Logistics Risk Management in Last-Mile Delivery: The Definitive 2026 Guide
Logistics risk management has become a defining priority for global supply chain leaders entering 2026, especially within the last mile — the narrowest, most variable, and most failure-prone segment of the entire logistics chain. Delivery networks now face more operational volatility, increasing compliance pressure, rising cargo-theft risk, fractured visibility across systems, and unprecedented temperature-control demands.
The last mile absorbs all of it.
This guide distills what global operators need to know: the emerging risk factors, the frameworks used to mitigate them, the controls that reduce exposure, and the criteria operators rely on when selecting low-risk last-mile partners. It draws on multi-industry patterns — including insights from healthcare networks, diagnostic labs, retail delivery ecosystems, and multi-site enterprise operations — to provide practical, evidence-backed guidance for 2026.
In 2024, cargo theft spiked to 3,655 reported incidents, a 26% year-over-year jump — disproportionately impacting last-mile environments — according to Verisk CargoNet’s 2024 Supply Chain Risk Report.
Healthcare networks tracked a rise in specimen misrouting driven by inconsistent procedures and limited chain-of-custody visibility. And across industries, SLA variability increasingly correlates with fragmented systems and inconsistent driver-level execution.
This guide expands beyond last-mile delivery into global risk management in logistics, covering the major risk factors in logistics management, international chain-of-custody implications, and how organizations build dedicated logistics risk management programs that scale across regions and regulatory environments.
What Is Logistics Risk Management?
Logistics risk management refers to the systems, controls, and governance practices used to identify, reduce, and monitor operational risks across the supply chain. In global networks, it encompasses physical risks (theft, spoilage, loss), compliance risks (HIPAA, CAP, OSHA, FSMA), environmental risks (temperature excursions, weather), and systemic risks (visibility gaps, system fragmentation, process drift).
While risk exists across all logistics stages, the last mile concentrates the most exposure. It involves real-world conditions that cannot be fully automated: driver decision-making, variable access points, diverse delivery environments, direct-to-consumer handoffs, and disparate technology systems. When disruptions occur upstream, they often manifest downstream — making the last mile the operational breakpoint of the entire supply chain.
In 2026, leading organizations treat last-mile risk as a strategic issue, not a carrier problem. Visibility, SOP discipline, temperature control, and governance are now core pillars of logistics strategy.
Core Risk Factors in Logistics Management
The global risk landscape now reflects five dominant drivers that shape reliability, cost control, and compliance across the last mile.
1. Human variability and SOP drift
Driver-level execution varies widely in global networks. SOP drift — where procedures diverge from documented expectations — is now one of the largest contributors to service failure. Variability shows up in:
- inconsistent urgency classification
- inconsistent elevation of exceptions
- inconsistent temperature-control practices
- inconsistent proof-of-delivery retrieval
Healthcare data shows that SOP inconsistency directly contributes to misrouting, redraws, and delayed pickups across multi-site environments.
2. Fragmented systems and limited real-time visibility
Organizations often manage between five and nine disconnected systems across routing, dispatch, lab or pharmacy platforms, warehouse systems, and carrier portals. Fragmentation creates mismatched timestamps, missing audit trails, and blind spots for exception management — all of which weaken chain of custody in last-mile logistics.
Gartner’s 2025 Supply Chain Visibility Report notes that multi-system fragmentation is now one of the top contributors to delivery error, SLA variance, and preventable compliance failures across global networks.
This fragmentation is the underlying cause of many misdelivery-pattern clusters in healthcare networks. Without unified visibility, organizations cannot identify root causes — and therefore cannot mitigate risk.
3. Temperature and environmental volatility
Climate variability introduces irregular heat events, cold snaps, and weather disruptions that extend exposure time outside controlled environments, requiring robust temperature-controlled delivery protocols. The highest-risk moments occur at handoffs: clinic counters, loading zones, porches, and receiving desks.
According to CLSI GP44 guidelines for specimen handling, restricted time-in-environment is critical for maintaining sample integrity — reinforcing the need for standardized urgency tiers and consistent temperature controls.
Sean Spector, CEO of Dropoff, captures the stakes clearly:
“A spoiled vial of chemotherapy isn’t a late package. It’s a treatment missed. A trial compromised. A life delayed.”
In high-stakes environments, environmental control isn’t just a regulatory requirement — it’s a patient-outcome requirement. That’s why modern logistics risk programs treat temperature control as a core risk domain, not a specialty feature.
4. Cargo theft and fraudulent pickups
Cargo theft growth has shifted last-mile risk significantly. Organized rings now use identity spoofing, cloned tracking pages, and fraudulent pickup attempts. The CargoNet 2024 annual report confirms rising sophistication and increased losses tied to last-mile vulnerabilities.
Smaller vehicles, predictable routes, and fragmented oversight create ideal conditions for targeted theft.
5. Regulatory pressure and chain-of-custody expectations
Healthcare, diagnostics, pharmaceuticals, and controlled goods now carry heightened compliance risk. Failures — even small ones — can trigger regulatory review, accreditation impact, or financial liability.
Examples include:
- HIPAA and CAP requirements for specimen integrity
- OSHA Bloodborne Pathogens Standard for safety
- USP <1079> and FSMA for temperature and food safety
- state and federal rules governing controlled substances
Across global markets, regulators expect digital traceability, complete chain-of-custody records, and documented temperature compliance.
Last-Mile Logistics Risk Management Framework (Five Pillars)
A mature logistics risk management program in the last mile always rests on five operational pillars. Across global healthcare networks, retail delivery ecosystems, and multi-site enterprise fleets, these pillars show up consistently because they reduce the highest-risk variables: human execution, visibility, environmental conditions, and governance drift. The following expanded framework reflects what advanced operators put in place to keep last-mile delivery predictable, compliant, and resilient.
1. People & Driver Controls
Human variability is still the single greatest risk factor in logistics management, and the last mile magnifies it. High-performing networks counter this with structured, measurable controls:
- Standardized driver onboarding and certification across all regions, covering chain-of-custody, temperature handling, biological specimen standards (referencing CLSI GP44), OSHA bloodborne pathogens requirements, and secure delivery protocols.
- Uniform escalation rules so every driver knows exactly when to flag a delay, environmental anomaly, access issue, or temperature risk.
- Identity-verified pickups to eliminate fraudulent handoffs, now one of the fastest-growing cargo-theft vectors according to CargoNet.
- Routine skills refresh cycles (quarterly or semi-annual) to combat SOP drift as networks grow.
When these controls are consistent across markets, SLA variability drops and exception patterns flatten — a sign of a stable, lower-risk last-mile network.
2. Technology & Real-Time Visibility
No risk mitigation strategy works without a single source of truth. Leading organizations unify routing data, handoff timestamps, PoD events, temperature logs, and exception workflows inside one visibility layer. This solves the fragmentation problem that drives misrouting and delayed clinical workflows.
Actionable elements include:
- Live GPS and telematics that provide real-time vehicle location, route adherence, and dwell-time anomalies.
- Unified dashboards that integrate courier data with customer systems (EHR, LIMS, OMS, WMS), eliminating mismatched timestamps or conflicting statuses.
- Exception detection and automated triggers — e.g., alerts based on temperature spikes, prolonged idle time, weather disruptions, or route deviations.
- Chain-of-custody compatibility that provides traceable, audit-ready documentation for every handoff.
This pillar turns last-mile delivery from a black box into something predictable, measurable, and governable.
As Sean Spector puts it:
“If you map every failure we’ve ever had, they fall into two buckets: something broke that shouldn’t have, or someone didn’t know it broke. That second one is worse. Visibility isn’t about GPS. It’s about accountability.”
This framing highlights why real-time visibility is foundational to last-mile risk management — not as a convenience, but as a control system that prevents small anomalies from snowballing into SLA failures or compliance events.
3. SOP Standardization
SOP drift is expensive. It creates unpredictable outcomes, inconsistent customer experiences, and hidden compliance risks. Advanced operators counter this by creating tight, globally consistent SOPs that apply across drivers, regions, and delivery types.
Core elements include:
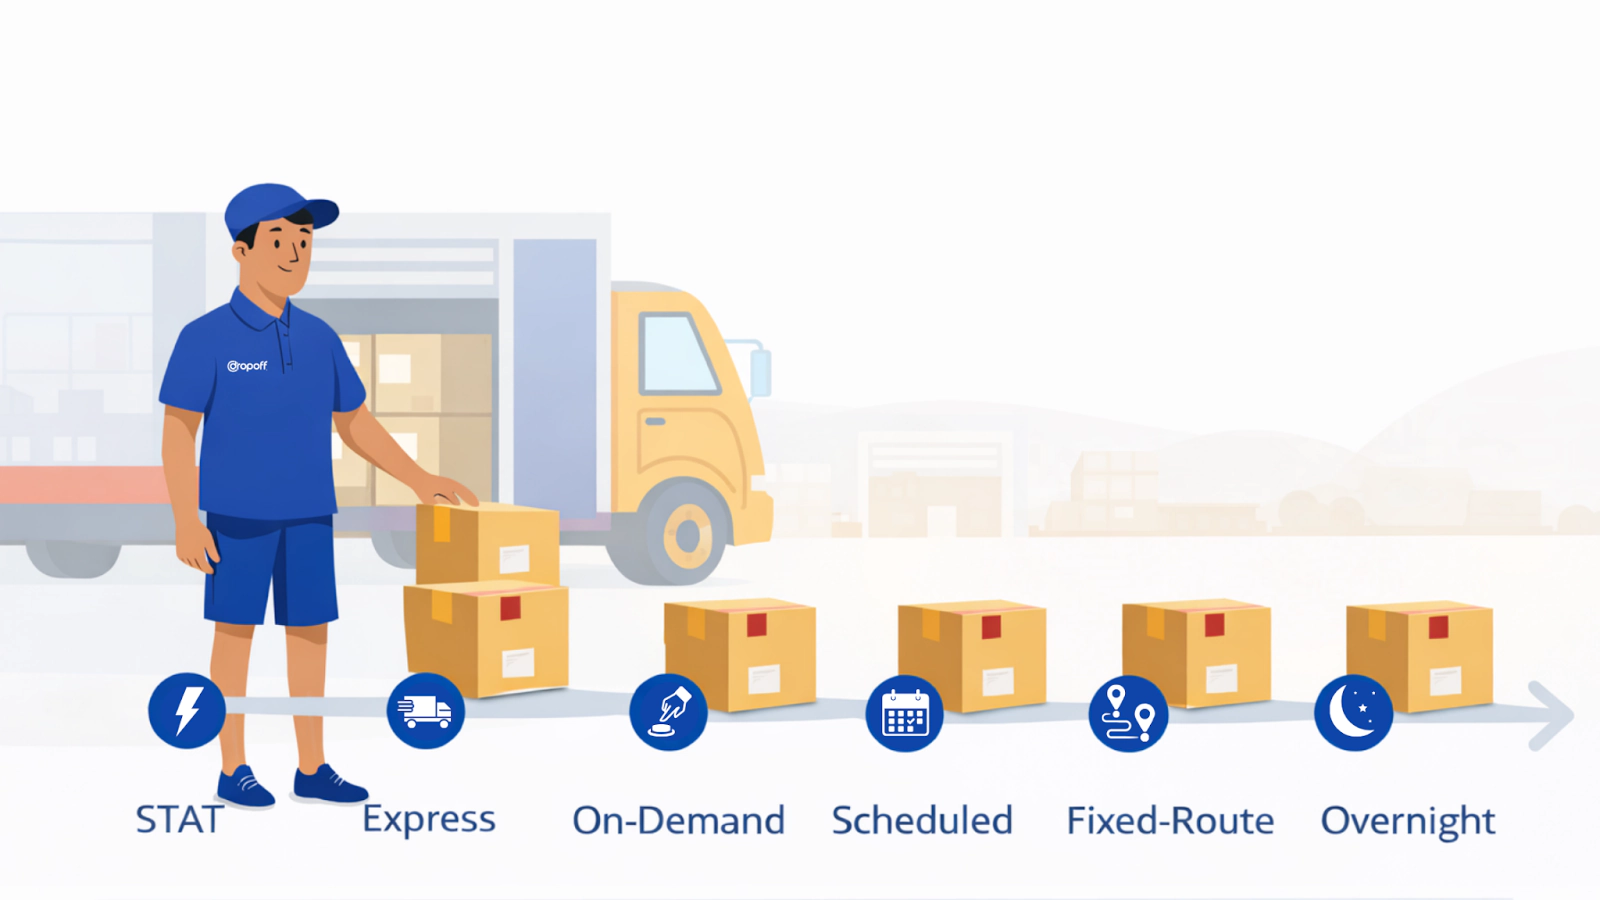
- Standardized urgency tiers (routine, urgent, STAT) based on medical necessity or business criticality.
- Uniform pickup and dropoff workflows, including ID verification, time stamping, temperature scanning, and documentation requirements.
- Clear escalation ladders for delays, no-access events, or environmental anomalies.
- Region-agnostic process definitions so performance does not depend on “who’s driving” or “which facility is receiving.”
When SOPs are truly standardized, operators see a drastic reduction in misdelivery, redraws, and exception clustering — the exact pattern described in CAP accreditation expectations.
4. Temperature & Environmental Control
Temperature excursions remain one of the highest-impact risks in last-mile logistics, directly affecting product integrity, regulatory exposure, and financial outcomes.
A robust environmental control pillar includes:
- Pre-conditioned packaging and validated thermal containers, which maintain product integrity for biologics, diagnostics, and specialty pharmaceuticals. Peer-reviewed research confirms that improper thermal protection is a leading cause of degradation.
(Journal of Pharmaceutical Sciences) - Strict time-in-environment limits, particularly during handoffs, loading, and porch-delivery scenarios. These limits align with internationally recognized temperature-controlled packaging standards.
(Springer Research Chapter on Product Integrity) - Real-time temperature monitoring, tied to exception alerts so excursions trigger immediate corrective workflows rather than being discovered after failure.
- Route planning that accounts for climate patterns, urban congestion, and micro-weather conditions, reducing exposure during critical legs.
In healthcare logistics, this pillar aligns closely with public FDA cold-chain expectations for biologics and diagnostics.
5. Governance & Continuous Improvement
The fifth pillar separates mature last-mile networks from reactive ones. Governance turns best practices into repeatable, measurable systems.
High-performing organizations implement:
- Recurring exception reviews (weekly or monthly) to identify patterns — not just individual failures.
- Root-cause analysis cycles are tied to SOP updates, training adjustments, or technology improvements.
- Full traceability reporting with audit trails that satisfy CAP, HIPAA, FSMA, and internal compliance committees.
- Systemwide performance reviews across regions, delivery types, and vendor relationships to identify systemic risk, not isolated incidents.
Leading organizations treat logistics governance like financial governance: structured, review-driven, and rooted in data rather than anecdotes.
How to Reduce Last-Mile Delivery Risk
Modern operators deploy targeted strategies to reduce risk exposure while improving predictability and throughput.
Create uniform escalation rules
Exceptions are early-warning indicators. Networks that treat exceptions uniformly across markets catch upstream issues earlier — before SLA degradation spreads.
Standardize urgency tiers to prevent STAT overuse
Overuse of STAT services inflates cost and introduces avoidable risk. A standardized tiering system (routine, urgent, STAT)—guided by clear principles on how STAT delivery works —ensures temperature-sensitive or clinically urgent shipments receive the right priority.
For healthcare organizations experiencing repeated delays, misclassification, or inconsistent urgency handling, it may also signal broader carrier issues. See indicators that you need a new medical courier service for examples of how poor tiering and process drift drive downstream failures.
Unify visibility across systems
A single source of truth reduces SLA variability and improves traceability. Fragmentation is one of the top causes of misrouting and inconsistent chain-of-custody.
Use identity-verified pickups and validated chain-of-custody
Fraudulent pickups increased across 2024–2025. CargoNet’s annual report highlights sophisticated impersonation tactics. Identity-verified pickups and timestamp-validated chain-of-custody dramatically reduce exposure.
Model environmental and temperature risk
Leveraging regional climate modeling, real-time weather forecasting, and temperature-compliance analytics helps prevent excursions. For operators moving biologics or diagnostics, this is now a compliance requirement.
Industry Risk Profiles (Healthcare, Retail, Enterprise)
Healthcare
Healthcare organizations relying on a medical courier service face fewer last-mile failures. Networks using general carriers experience specimen integrity loss, redraws, delayed therapy, and inconsistent chain-of-custody. File-based data shows misrouting and inconsistent chain-of-custody among the top risks.
Retail
Retail operators face theft exposure, holiday surge variability, fraud, and delivery density challenges. High-value goods draw targeted theft, while inconsistent PoD practices create disputes and refunds.
Enterprise & Field Services
Multi-site networks must manage SLA variability, inconsistent escalation behavior, and limited visibility across systems. Governance is often the weakest link — not technology.
KPIs That Reveal Real Logistics Risk
Operators increasingly use KPIs not just to track performance, but to diagnose underlying risk exposure across the last mile. These metrics surface patterns that traditional dashboards often obscure—especially when measured consistently across regions, delivery types, and carrier partners.
SLA Accuracy (to the Minute)

Minute-level SLA accuracy reveals micro-delays that “on-time by window” reporting hides. Small pockets of delay—tied to specific routes, facilities, or drivers—often signal weak SOP adherence or early signs of system fragmentation. Operators benchmark these patterns alongside broader last-mile delivery KPIs to understand how timing drift accumulates into meaningful risk.
What good looks like:
- 94–98% SLA accuracy measured at minute granularity
- Minimal variance between regions and shifts
- Predictable performance across routes
Red flags:
- High variability between identical routes
- End-of-day clustering of SLA misses
- Dependence on wide delivery windows instead of precise timestamps
Excursion Rate
Excursion rate tracks the percentage of deliveries exceeding environmental or temperature thresholds. A rising trend almost always points to weak handoff discipline, route bottlenecks, or seasonal vulnerabilities. Insights often emerge earlier in last-mile analytics, which highlight environmental drift before it becomes a compliance issue.
What good looks like:
- <1% excursions across all climates
- No route-, facility-, or driver-specific patterns
- Zero undocumented time-in-environment events
Red flags:
- Seasonal spikes that repeat
- Excursions concentrated around certain facilities
- Failures discovered after delivery rather than in real time
First-Attempt Delivery Rate
Every failed first attempt creates a disproportionate cost cascade: rerouting, rescheduling, customer escalation, and increased time-in-environment. In high-value or temperature-controlled categories, failure at first delivery is also correlated with theft and spoilage. These trends align with known last-mile e-commerce delivery challenges,where address quality, communication gaps, and availability issues consistently undermine success rates.
What good looks like:
- 95%+ first-attempt success
- Consistent performance across delivery windows and zones
- Clear customer-availability intelligence
Red flags:
- Repeat failures at the same locations
- High-risk theft environments
- Weak pre-delivery communication
Exception Pattern Clustering
The value of exceptions lies not in the count, but in the repeatability. Clusters of similar anomalies—wrong-door deliveries, recurring delays at the same facility, geographically concentrated temperature deviations—often reveal structural weaknesses. Strong last-mile delivery tracking surfaces these repeat patterns earlier, enabling faster root-cause analysis.
What good looks like:
- No recurring patterns across routes or facilities
- Exceptions escalated consistently and quickly
- Centralized, standardized categorization
Red flags:
- Same exception type recurring in the same facility or region
- Multiple drivers displaying identical anomalies
- High frequency of “no access” or “wrong-door” events
Chain-of-Custody Completion Rate
Incomplete chain-of-custody logs—missing signatures, partial timestamps, inconsistent PoD methods—signal compliance drift or gaps in driver discipline. For healthcare and regulated networks, dips in this KPI often precede audit findings. This is also a core logistics compliance KPI that operators use to validate whether a carrier’s SOPs remain consistent across markets.
What good looks like:
- 99%+ documented chain-of-custody (signatures + timestamps + validated PoD)
- Zero undocumented handoffs
- Uniform compliance across all regions
Red flags:
- Missing signatures during after-hours pickups
- Manual timestamps instead of automated scans
- Mixed PoD methods within the same network
Temperature Compliance
Temperature compliance reflects how reliably goods remain within required ranges despite real-world conditions. The KPI is influenced by driver execution, packaging, route design, and climate volatility. Programs that leverage temperature-monitoring analytics can identify drift early—before it results in excursions, spoilage, or regulatory exposure.
What good looks like:
- 97–100% temperature compliance
- No “grey zones” during porch sits, counter waits, or facility handoffs
- Route duration aligned to product stability
Red flags:
- Failures concentrated at handoff rather than in transit
- Weather-dependent performance spikes
- Lack of real-time environmental monitoring
Summary Scorecard
Use this consolidated view for executive reporting:
| KPI | Good | Warning | Critical |
| SLA Accuracy | ≥ 94% | 92–94% | < 92% |
| Excursion Rate | < 1% | 1–1.5% | > 1.5% |
| First-Attempt Delivery | ≥ 95% | 93–95% | < 93% |
| Exception Clustering | None | 1–2 repeats | ≥ 3 repeats in 14 days |
| Chain-of-Custody | ≥ 99% | 98–99% | < 98% |
| Temperature Compliance | ≥ 97% | 96–97% | < 96% |
How to Choose a Low-Risk Last-Mile Delivery Partner
The right partner doesn’t just “deliver packages.” They reduce operational uncertainty, preserve compliance, and protect clinical or commercial workflows. The wrong one quietly amplifies risk until it becomes visible in SLA misses, retracing, spoilage, and downstream cost.
Nick Araiza, VP of Sales at Dropoff, summarizes the reality many operators eventually learn:
“Cheaper couriers look good on paper — until the first failure wipes out every dollar you saved.”
This is why advanced operators evaluate partners on visibility, compliance discipline, SOP alignment, and temperature control — not price alone.
Below is a more robust, operator-grade expansion of each criterion.
Visibility Standards
A low-risk partner delivers one version of the truth — unified, real-time visibility across dispatch, routing, handoffs, temperature, and delivery confirmation.
What that means in practice:
- A single pane of glass, not fragmented portals.
- Automated alerts before an SLA breach — not apologies afterward.
- End-to-end event logs: pickup → transit → handoff → environmental data.
- Integration with your existing dashboards so operations doesn’t need to “check another system.”
Why this matters: Fragmented visibility is one of the top predictors of misroutes, temperature excursions, and exception escalation.
Compliance & Chain-of-Custody Discipline
Compliance is not paperwork — it’s risk containment.
A qualified partner should operationalize HIPAA, CAP, OSHA, FSMA, state-level regs, and product-specific guidance into driver behavior and platform behavior — supported by proven Dropoff compliance capabilities.
What to look for:
- Digitally enforced chain-of-custody (no manual timestamps).
- Proof-of-delivery that verifies location, identity, and time.
- Built-in audit trails stored in tamper-evident logs.
- Drivers trained to treat clinical materials, pharmaceuticals, and sensitive goods as regulated items — not generic parcels.
Why this matters: Most compliance failures trace back to inconsistent handoffs or undocumented chain-of-custody — both preventable with the right partner.
Driver Training & SOP Reliability
True reliability is a function of standardization and repeatability.
A low-risk partner runs drivers, dispatchers, and warehouse teams on the same playbook — every shift, every market.
Strong partners deliver:
- Standardized onboarding and certification for all drivers.
- Recurrent training for temperature control, medical handling, and exception escalation.
- Uniform SOPs for pickup, packaging verification, delivery, PoD, and returns.
- Routine market audits to identify drift before it becomes systemic.
Why this matters: SOP drift is one of the most expensive (and least visible) sources of risk in last-mile delivery.
Technology Stack Integration
A stable last-mile partner doesn’t bolt onto your workflow — they plug into it.
Look for:
- Direct integrations with EHR platforms, LIS systems, pharmacy dispensing systems, and inventory management.
- Automated order ingestion (no manual rekeying).
- API-based visibility that pushes data to your systems, not just theirs.
- Cloud-based audit logs accessible to ops, compliance, and finance teams.
Why this matters: Every manual step added to the chain increases error probability.
Integration reduces delays, improves forecasting, and makes every handoff auditable.
Surge Capacity & Business Continuity
Critical deliveries don’t pause for weather, flu season, or a driver calling out.
A low-risk partner has redundancy in personnel, routes, and fleet, and can flex volume without degradation.
Look for:
- Backup drivers and alternates staged by geography.
- Route-level redundancy plans for high-risk corridors.
- On-call dispatch and escalation teams.
- Disaster recovery playbooks for extreme weather, power outages, or system downtime.
Why this matters: The biggest operational failures happen not on good days, but when volumes spike or something breaks upstream.
What Advanced Operators Look For
High-performing logistics teams choose partners who:
- Reduce uncertainty, not add new blind spots.
- Strengthen compliance rather than gamble with “good enough.”
- Improve traceability, so every mile and handoff is verifiable.
- Support governance, providing audit data, exception analytics, and transparency that improves the entire network.
In short: A low-risk partner doesn’t just move products — they de-risk the system that moves them.
FAQ
Logistics risk management is the discipline of controlling the operational, compliance, and environmental risks that appear across the supply chain — especially during the last mile, where variability is highest. It brings together standardized processes, trained personnel, technology, and governance to ensure shipments remain on time, compliant, temperature-stable, and fully traceable.
In practice, this means eliminating preventable failures, reducing uncertainty, and giving operators the visibility they need to intervene before issues cascade.
The biggest risks in modern logistics come from variability — in processes, environments, and human decision-making. Networks typically face exposure from inconsistent driver execution, procedural drift across markets, limited visibility into where shipments actually are, temperature swings during transit, and the growing threat of cargo theft.
Regulatory pressure adds another layer of complexity. Requirements tied to HIPAA, CAP, OSHA, FSMA, and DSCSA raise the stakes for even minor mistakes, making standardized controls essential for reducing overall logistics risk.
The last mile is risk-heavy because it operates in unpredictable, real-world conditions. Shipments move through traffic, weather, residential settings, and facilities with varying levels of process discipline. Multiple handoffs — often across different systems — create gaps in visibility. And because the last mile is where urgency peaks, even small delays or environmental exposures can quickly escalate into SLA failures or compliance breaches.
It’s the part of the supply chain with the fewest controlled variables, which is why a structured last-mile risk management approach matters.
Reducing last-mile risk requires combining standardized procedures, real-time visibility, and tight operational control. Organizations start by unifying their tracking and chain-of-custody data so every decision is made from a single source of truth. Risk drops further when pickup and dropoff processes follow the same rules across every market, when drivers are trained and validated consistently, and when temperature-sensitive shipments follow predictable time-in-environment limits.
Layered on top is governance — the regular review of exceptions, audits, and performance scorecards to ensure the network stays disciplined as volume and complexity grow.
A dedicated program is a centralized governance model that applies consistent controls, visibility, and escalation procedures to every part of a logistics network. Instead of allowing each region or partner to operate independently, the program defines one set of SOPs, one visibility platform, one chain-of-custody framework, and one audit cadence.
The result is a network that behaves predictably, maintains compliance at scale, and improves over time — a necessity for industries like healthcare, pharmacy, biotech, and regulated retail where the cost of failure is high.
Final Takeaways for 2026
The last mile is now where operational risk becomes organizational risk — affecting customer experience, compliance posture, financial exposure, and brand reputation. In 2026, logistics leaders need proactive, systemwide strategies that blend visibility, SOP discipline, environmental modeling, temperature control, and governance.
Dropoff supports global operators with solutions built around these principles — from healthcare compliance expertise to unified visibility and rigorous chain-of-custody. Get started to explore how your organization can reduce last-mile risk.